Amazon CloudWatch is a monitoring and management service provided by Amazon Web Services (AWS) that helps you collect and track metrics, monitor log files, set alarms, and take automated actions to keep your AWS resources and applications running efficiently. CloudWatch provides insights into the operational health of your AWS resources and applications, allowing you to troubleshoot issues, optimize performance, and ensure the reliability of your cloud infrastructure.
Key Features and Functionalities of Amazon CloudWatch
1. Metrics and Dashboards
Amazon CloudWatch allows you to collect and visualize metrics for various AWS resources, such as EC2 instances, RDS databases, and Lambda functions. You can create custom dashboards to monitor and display these metrics in a way that suits your needs. Below, we’ll explore the key aspects of metrics and dashboards in Amazon CloudWatch:
Understanding Metrics
Metrics are the fundamental concept in Amazon CloudWatch, representing the time-ordered set of data points. These data points are variables that you can measure for your AWS resources. For example, you might track CPU utilization, disk reads/writes, or network traffic.
Amazon CloudWatch provides both built-in metrics and the ability to publish custom metrics. Built-in metrics are automatically collected and tracked by AWS for supported services. Custom metrics allow you to define specific measurements that are unique to your application or business needs.
Creating and Customizing Dashboards
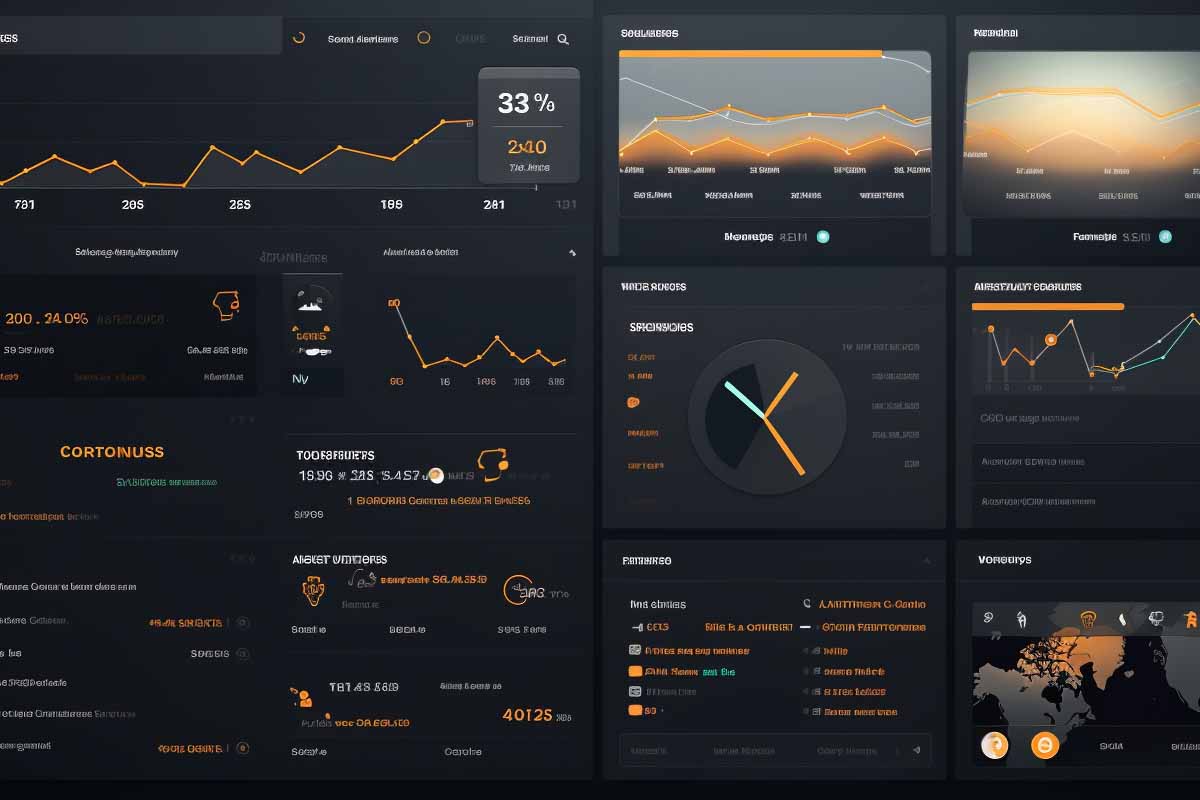
Amazon CloudWatch Dashboards provide a customizable view of the metrics and alarms for your AWS resources. You can create a dashboard to display data from different AWS services, and even from different regions, all in one place.
- Widgets: You can add various widgets to your dashboard, such as graphs, tables, or text. These widgets allow you to present the metrics in different visual formats, making it easier to interpret the data.
- Real-Time Monitoring: Dashboards update in real-time, allowing you to see the current state of your resources. This real-time view can be crucial for identifying and responding to issues as they arise.
- Sharing and Collaboration: Amazon CloudWatch dashboards can be shared with team members, providing a collaborative space for monitoring and analysis. You can also embed dashboards in other applications or web pages.
AWS Cloud Practitioner Training
Ready to elevate your career in the cloud? Whether you’re an AWS Solutions Architect, Developer, Cloud Engineer, Admin, Networking Specialist, Cloud Practitioner, or a Big Data Expert, this AWS Certified Cloud Practitioner course is your gateway to deeper understanding and mastery of the AWS Cloud Platform. Join us to enhance your cloud fluency and take a transformative step towards becoming an AWS expert!
Analyzing Data with CloudWatch Insights
Amazon CloudWatch also offers Insights, a feature that helps you analyze, troubleshoot, and optimize your resources. You can use Insights to query your metrics, perform statistical analyses, and visualize the results. This deeper analysis can lead to more informed decisions and proactive responses to trends or anomalies.
Metrics and dashboards in Amazon CloudWatch provide a powerful toolset for monitoring the performance and health of your AWS resources. By collecting relevant metrics and visualizing them through custom dashboards, you gain a clear and actionable view of your cloud environment. Whether you’re tracking standard AWS metrics or defining your own custom measurements, Amazon CloudWatch offers the flexibility and insights needed to ensure optimal performance and reliability.
2. Alarms
With Amazon CloudWatch, you can set up alarms to monitor metrics and trigger automated actions when certain conditions are met. For example, you can receive notifications or execute AWS Lambda functions when a specific metric crosses a threshold. Below, we’ll delve into the key aspects of alarms in Amazon CloudWatch:
Understanding Alarms
An alarm in Amazon CloudWatch watches a single metric over a specified time period and performs one or more actions based on the value of the metric relative to a threshold. Alarms are used to detect and respond to abnormal patterns or potential issues within your AWS environment.
Types of Alarms
- Threshold Alarms: These are the most common type of alarms, triggered when a metric crosses a specified threshold. You can set the threshold based on static values or statistical calculations.
- Anomaly Detection Alarms: These alarms use machine learning algorithms to detect abnormal patterns in the metrics. They can automatically adapt to changing trends, providing a more dynamic way to monitor your resources.
- Composite Alarms: Composite alarms combine multiple alarms to create more complex conditions. They allow you to use logical operators (AND, OR, NOT) to evaluate multiple alarms together.
Setting Up Alarms
Creating an alarm in Amazon CloudWatch involves selecting a metric, defining the conditions, and specifying the actions to take when the alarm state is triggered. Here’s a step-by-step process:
- Choose a Metric: Select the metric you want to monitor, such as CPU utilization or network in/out.
- Define Conditions: Set the threshold and comparison operator (e.g., greater than, less than) for the alarm. You can also choose the evaluation period and statistical method.
- Specify Actions: Choose what actions to take when the alarm is triggered. Actions can include sending notifications, stopping or starting instances, or invoking AWS Lambda functions.
Integrating with Other AWS Services
Amazon CloudWatch alarms can be integrated with other AWS services to create automated workflows. For example:
- Amazon SNS: Send notifications via email, SMS, or other channels when an alarm is triggered.
- AWS Lambda: Execute custom code to respond to the alarm, such as scaling resources or modifying configurations.
- Amazon EC2 Auto Scaling: Automatically adjust the number of running EC2 instances based on the alarm’s state.
Alarms in Amazon CloudWatch provide a robust and flexible way to monitor and respond to changes in your AWS resources. By setting up alarms, you can proactively manage your environment, taking automated actions to address issues, optimize performance, and maintain the reliability of your applications and services. Whether you’re using simple threshold alarms or more complex composite conditions, Amazon CloudWatch offers the tools and integrations needed to create a responsive and resilient cloud infrastructure.
AWS Beginners Course
Ready to unlock the power of AWS Storage Gateway? In this Amazon Web Services Beginners online training course, you’ll dive into creating and managing gateways, mastering the three modes, and applying vital security features to protect data. Don’t miss this opportunity to elevate your skills and become a proficient guardian of both gateway and cloud data!
3. Log Monitoring
Amazon CloudWatch Logs enables you to collect, monitor, and analyze log files generated by your applications and AWS resources. You can search, filter, and gain insights from log data using CloudWatch Logs Insights. Below, we’ll explore the key aspects of log monitoring in Amazon CloudWatch:
Collecting Logs
Amazon CloudWatch Logs can collect and store logs from various sources, including:
- AWS Resources: Such as Amazon EC2 instances, AWS Lambda functions, and Amazon RDS databases.
- Applications: Logs generated by your custom applications running on AWS or on-premises servers.
- Operating Systems: System logs from Windows, Linux, or other operating systems.
- Third-Party Tools: Integration with popular logging frameworks and services.
You can use the CloudWatch agent or AWS SDKs to send logs to CloudWatch, providing a centralized repository for all your log data.
Analyzing Logs with CloudWatch Logs Insights
CloudWatch Logs Insights is a fully integrated, interactive log analytics service. It allows you to:
- Search and Filter: Use a purpose-built query language to search and filter log data based on specific fields, patterns, or conditions.
- Visualize Data: Create charts and graphs to visualize patterns and trends in your log data.
- Analyze Performance: Identify performance bottlenecks, errors, or other issues by analyzing log data.
- Save and Share Queries: You can save your queries for future use and share them with other team members.
Monitoring and Alarming
You can set up custom metrics and alarms based on log data. For example, you can create an alarm that triggers if the error rate in your application logs exceeds a certain threshold.
Archiving and Retention
Amazon CloudWatch Logs allows you to control the retention period for your log data. You can choose to keep logs for a specific number of days or indefinitely. You can also archive logs to Amazon S3 for long-term storage and compliance purposes.
Integration with Other AWS Services
CloudWatch Logs can be integrated with other AWS services to enhance monitoring and analysis:
- Amazon Athena: Query archived logs in Amazon S3 using SQL.
- AWS Lambda: Trigger custom actions or workflows based on log data.
- Amazon Elasticsearch Service: Perform advanced log analytics and visualization.
Security and Compliance
Amazon CloudWatch Logs provides features to help you meet security and compliance requirements, such as encryption at rest and in transit, access control using IAM policies, and integration with AWS CloudTrail for auditing.
Log monitoring in Amazon CloudWatch provides a comprehensive solution for collecting, analyzing, and acting on log data from various sources. Whether you’re troubleshooting issues, optimizing performance, or ensuring security and compliance, Amazon CloudWatch Logs offers the tools and integrations needed to gain valuable insights and maintain control over your AWS environment.
Cloud Computing Courses
10 Course Series!
Are you ready to ride the wave of cloud computing? With over 130 hours of training across 10 comprehensive courses, this bundle is your ticket to mastering Amazon Web Services (AWS), Microsoft Azure, VMWare vSphere, and more. Whether you’re planning a migration or expanding in-house infrastructure through virtualization, seize this opportunity to become a cloud computing expert!
4. Events and Event Rules
CloudWatch Events, part of the Amazon CloudWatch suite, provides a way to respond to changes in your AWS resources. You can create event rules that match events and take actions in response, such as invoking Lambda functions or sending messages to Amazon SNS topics. Below, we’ll explore the key aspects of events and event rules in Amazon CloudWatch:
Understanding CloudWatch Events
CloudWatch Events are system events that describe changes in AWS resources. These can include changes in the state of an EC2 instance, modifications to a security group, or API calls made within your AWS environment. CloudWatch Events helps you detect and respond to these changes in real-time.
Creating Event Rules
Event rules in Amazon CloudWatch allow you to define specific conditions or patterns that you want to match. When an event matches a rule, the specified actions are triggered. Here’s how you can create an event rule:
- Select Event Source: Choose the AWS service or resource you want to monitor.
- Define Pattern: Specify the pattern or condition that you want to match. This can be based on specific attributes, values, or a combination of factors.
- Set Target Actions: Choose the actions to take when the event matches the rule. This can include invoking a Lambda function, sending a message to an SNS topic, or triggering a Step Functions workflow.
Types of Event Patterns
- Predefined Patterns: Amazon CloudWatch provides predefined patterns for common AWS services and events. These can be used as-is or customized to fit your specific needs.
- Custom Patterns: You can create custom event patterns using JSON, allowing you to define complex conditions and match specific attributes or values.
Integrating with Other AWS Services
CloudWatch Events can be integrated with various AWS services to create automated workflows and responses:
- AWS Lambda: Execute custom code to process the event or take specific actions.
- Amazon SNS: Send notifications via email, SMS, or other channels.
- AWS Step Functions: Trigger a multi-step workflow to coordinate multiple AWS services.
- Amazon ECS: Launch or modify containerized applications in response to events.
Scheduling Events
In addition to responding to system events, you can also use CloudWatch Events to schedule recurring or one-time actions. This can be used to automate maintenance tasks, backups, or other operational activities.
Security and Compliance
Amazon CloudWatch Events supports IAM roles and policies to control access and permissions. You can define who can create, modify, or delete event rules, ensuring that only authorized users can manage events and actions.
Events and event rules in Amazon CloudWatch provide a powerful mechanism to detect and respond to changes in your AWS environment. Whether you’re automating responses to system changes, integrating with other AWS services, or scheduling regular tasks, CloudWatch Events offers the flexibility and control needed to create dynamic, responsive, and efficient workflows. By leveraging CloudWatch Events, you can enhance the agility, reliability, and security of your AWS resources, ensuring that you’re always aware of and able to respond to important changes and conditions.
5. Application Insights
For specific AWS services like EC2 instances and .NET applications, Amazon CloudWatch Application Insights helps you identify and troubleshoot application performance issues by automatically analyzing data and providing actionable insights. Below, we’ll explore the key aspects of Application Insights in Amazon CloudWatch:
Understanding Application Insights
Amazon CloudWatch Application Insights is a monitoring and diagnostics service designed to simplify the troubleshooting of application issues. It automatically detects common problems and anomalies in the application stack and provides detailed insights to help you understand the root cause of the issues.
Supported Technologies
Application Insights supports monitoring for various technologies and platforms, including:
- AWS Resources: Such as Amazon EC2, Amazon RDS, and AWS Lambda.
- Application Platforms: Including .NET, SQL Server, Java, and more.
- Operating Systems: Windows and Linux-based systems.
How It Works
- Setup and Configuration: You can easily set up Application Insights through the AWS Management Console. Select the resources you want to monitor, and Application Insights will automatically discover the related dependencies and components.
- Automatic Analysis: Application Insights continuously analyzes metrics, logs, and traces to detect anomalies and performance issues. It uses machine learning and pre-built analysis templates to identify common problems.
- Insights and Recommendations: When an issue is detected, Application Insights provides detailed insights into the problem, along with recommendations for resolution. This can include information about affected resources, related events, and suggested remediation steps.
- Integration with CloudWatch Dashboards: You can view the insights and analysis directly in your CloudWatch dashboards, allowing you to correlate application insights with other metrics and logs.
Key Features
- Anomaly Detection: Uses machine learning to detect unusual patterns and behavior in your application data.
- Root Cause Analysis: Automatically identifies the root cause of performance issues, helping you pinpoint the underlying problem.
- Customizable Alerts: You can set up custom alarms and notifications based on the insights and analysis, ensuring that you’re promptly informed of any issues.
- End-to-End Visibility: Provides a comprehensive view of your application stack, including infrastructure, application code, databases, and external services.
Use Cases
Amazon CloudWatch Application Insights can be used for various scenarios, such as:
- Performance Optimization: Identify and resolve performance bottlenecks, improving the responsiveness and efficiency of your applications.
- Error Troubleshooting: Quickly diagnose and fix errors and exceptions in your application code or infrastructure.
- Capacity Planning: Analyze trends and patterns to make informed decisions about scaling and resource allocation.
Amazon CloudWatch Application Insights offers a powerful solution for monitoring and troubleshooting application performance across a wide range of technologies and platforms. By automatically analyzing data and providing actionable insights, it simplifies the task of identifying and resolving issues, saving time and reducing downtime. Whether you’re managing complex enterprise applications or smaller custom solutions, Application Insights provides the tools and intelligence needed to maintain optimal performance, reliability, and user satisfaction.
CompTIA Cloud+ (Plus)
IEmbark on a journey to master the cloud with our CompTIA Cloud+ training course! Gain the essential skills and knowledge to build, optimize, and ensure the high availability of today’s complex cloud environments. Tailored to cover all the objectives for the CompTIA Cloud+ CV0-003 certification exam, this course is your stepping stone to a thriving career in cloud computing. Don’t miss out – elevate your expertise and become a cloud pro!
6. Anomaly Detection
Amazon CloudWatch Anomaly Detection uses machine learning to create baselines for your metrics and detect anomalies, helping you identify unexpected behavior and potential issues. Below, we’ll explore the key aspects of anomaly detection in Amazon CloudWatch:
Understanding Anomaly Detection
Anomaly detection is the process of identifying patterns in data that do not conform to expected behavior. In the context of Amazon CloudWatch, it refers to the automatic identification of unusual patterns or outliers in your metrics, which could signal potential problems or areas for investigation.
How It Works
- Creating Baselines: Amazon CloudWatch Anomaly Detection uses machine learning algorithms to analyze historical data and create a baseline model of normal behavior for your metrics. This baseline represents the expected pattern or range of values for the metric.
- Real-Time Monitoring: Once the baseline is established, CloudWatch continuously monitors the metric in real-time, comparing the incoming data to the baseline.
- Detecting Anomalies: If the metric deviates significantly from the baseline, it’s flagged as an anomaly. This deviation could be a sudden spike, a drop, or a gradual trend that doesn’t align with historical patterns.
- Alerting and Actions: You can set up alarms that trigger when an anomaly is detected, allowing you to take immediate action, such as sending notifications or automating responses.
Key Features
- Automatic Learning: CloudWatch Anomaly Detection automatically adapts to changes in patterns and trends, continuously updating the baseline as new data comes in.
- Customizable Sensitivity: You can adjust the sensitivity of the anomaly detection, controlling how aggressively it identifies deviations from the baseline.
- Visualization: Anomaly Detection provides visualizations that overlay the expected baseline with the actual metric data, making it easy to see where anomalies have occurred.
- Integration with Other CloudWatch Features: You can use anomaly detection with other CloudWatch features like dashboards, alarms, and insights, creating a comprehensive monitoring solution.
Use Cases
Amazon CloudWatch Anomaly Detection can be applied to various scenarios, including:
- Performance Monitoring: Detect unexpected spikes or drops in system performance, such as CPU utilization, memory usage, or network traffic.
- Security Analysis: Identify unusual patterns that might indicate a security breach or malicious activity.
- Cost Management: Monitor AWS billing metrics to detect abnormal increases in costs or usage.
- Business Metrics: Analyze custom business metrics to identify trends or opportunities that might otherwise go unnoticed.
Amazon CloudWatch Anomaly Detection provides a powerful tool for automatically identifying and responding to unexpected behavior in your metrics. By leveraging machine learning to create dynamic baselines and detect deviations, it offers a proactive approach to monitoring and troubleshooting. Whether you’re concerned about system performance, security, costs, or business insights, Anomaly Detection adds an intelligent layer to your monitoring strategy, helping you stay ahead of potential issues and make informed decisions.
7. Integration with AWS Services
Amazon CloudWatch seamlessly integrates with various AWS services, allowing you to monitor and manage their performance and health. This integration enables you to have a unified view of your entire AWS environment, enhancing your ability to maintain optimal performance, reliability, and security. Below, we’ll explore some key aspects of integration with AWS services in Amazon CloudWatch:
Monitoring AWS Resources
Amazon CloudWatch provides built-in monitoring for many AWS services, including but not limited to:
- Amazon EC2: Monitor instances for CPU utilization, network traffic, and more.
- Amazon RDS: Track database performance, such as query execution times and connection counts.
- AWS Lambda: Observe function execution times, error rates, and invocation counts.
- Amazon S3: Analyze storage usage, request patterns, and data transfer rates.
- Amazon DynamoDB: Monitor read and write capacity, throttling events, and latency.
These integrations allow you to collect, visualize, and analyze metrics without the need for additional configuration or instrumentation.
Alarms and Automated Actions
You can set up CloudWatch alarms for various AWS services, triggering automated actions based on specific conditions. For example:
- Auto Scaling: Adjust the number of running EC2 instances based on demand.
- Recovery Actions: Automatically recover or restart failed EC2 instances.
- Notification: Send alerts via Amazon SNS when a threshold is breached.
Log Collection and Analysis
Amazon CloudWatch Logs can collect and analyze logs from various AWS services, such as:
- VPC Flow Logs: Capture information about IP traffic in your VPC.
- AWS CloudTrail: Log and monitor AWS account activity and API usage.
- Lambda Function Logs: Capture logs from Lambda function executions.
Integration with AWS Management Tools
CloudWatch integrates with other AWS management and automation tools, enhancing your ability to manage and optimize your environment:
- AWS CloudFormation: Use CloudWatch metrics and alarms within CloudFormation templates to automate resource provisioning and scaling.
- AWS Systems Manager: Utilize CloudWatch data within Systems Manager for automation, patch management, and configuration control.
Custom Metrics and Extensions
Beyond built-in integrations, you can also publish custom metrics from your applications or use CloudWatch agent extensions to monitor additional resources and services.
Cross-Account and Cross-Region Monitoring
Amazon CloudWatch supports monitoring resources across different AWS accounts and regions, providing a centralized view of your entire AWS infrastructure.
8. Custom Metrics
You can publish custom metrics to Amazon CloudWatch using the AWS SDKs or API. This allows you to monitor and collect data specific to your applications and use cases. Custom metrics provide a way to extend CloudWatch’s monitoring capabilities beyond the built-in metrics provided by AWS services. Below, we’ll explore the key aspects of custom metrics in Amazon CloudWatch:
Understanding Custom Metrics
Custom metrics are user-defined measurements that you can create to monitor specific aspects of your applications, infrastructure, or business processes. Unlike the standard metrics that AWS services automatically send to CloudWatch, custom metrics are created and managed by you, providing flexibility to track what’s most important to your unique needs.
Creating Custom Metrics
Here’s how you can create and publish custom metrics to Amazon CloudWatch:
- Define the Metric: Determine what you want to measure, such as user sign-ups, transaction latency, or custom performance counters.
- Choose the Namespace: Metrics in CloudWatch are organized into namespaces. You can create a custom namespace or use an existing one.
- Set Dimensions: Dimensions are name-value pairs that help you filter and aggregate metrics. You can define custom dimensions to categorize your metrics.
- Publish the Metric: Use the AWS SDKs, CLI, or API to send the metric data to CloudWatch. You can publish data in real-time or batch multiple data points together.
Key Features
- High Resolution: You can publish custom metrics with a resolution as high as one second, allowing for detailed, real-time monitoring.
- Aggregation: CloudWatch automatically aggregates custom metrics at different intervals, providing summaries and trends over time.
- Alarms and Actions: You can set up CloudWatch alarms on custom metrics, triggering notifications or automated actions based on specific conditions.
- Visualization: Custom metrics can be visualized in CloudWatch dashboards, alongside other AWS metrics, for a unified view of your environment.
Use Cases
Custom metrics can be applied to various scenarios, including:
- Application Monitoring: Track custom performance indicators, error rates, or user behavior within your applications.
- Business Metrics: Monitor business-related metrics like sales, customer engagement, or conversion rates.
- Hybrid Environments: Collect metrics from on-premises servers or non-AWS cloud resources, integrating them into your CloudWatch monitoring.
Integration with Other AWS Services
Custom metrics can be used in conjunction with other AWS services, such as:
- AWS Lambda: Trigger Lambda functions based on custom metric values.
- Amazon SNS: Send notifications or alerts when custom metrics breach defined thresholds.
- AWS Auto Scaling: Scale resources based on custom application or system metrics.
Custom metrics in Amazon CloudWatch provide a powerful and flexible way to extend your monitoring capabilities, allowing you to track and respond to the specific needs and priorities of your applications and business. By defining and publishing custom metrics, you gain deeper insights and control over your environment, enhancing your ability to optimize performance, respond to issues, and align with your strategic goals. Whether you’re monitoring custom application behavior, tracking business KPIs, or integrating non-AWS resources, custom metrics offer a tailored solution that adapts to your unique requirements.
9. Cross-Account and Cross-Region Support
You can set up Amazon CloudWatch to monitor resources in different AWS accounts and regions, providing a unified monitoring solution for complex environments. This feature is particularly valuable for organizations that operate across multiple accounts and geographical locations, enabling centralized visibility and control. Below, we’ll explore the key aspects of cross-account and cross-region support in Amazon CloudWatch:
Cross-Account Monitoring
Amazon CloudWatch’s cross-account monitoring allows you to collect and view metrics from multiple AWS accounts in a single CloudWatch dashboard. This capability offers several benefits:
- Centralized Visibility: View and analyze metrics from all your accounts in one place, simplifying monitoring and reducing the need to switch between accounts.
- Unified Alarms and Notifications: Set up alarms and notifications across accounts, ensuring consistent alerting and response.
- Role-Based Access Control: Use AWS Identity and Access Management (IAM) to define roles and permissions, controlling who can view or modify cross-account metrics.
- Integration with AWS Organizations: If you’re using AWS Organizations, you can easily enable cross-account monitoring for all accounts within the organization.
Cross-Region Monitoring
With cross-region monitoring, you can view and manage metrics from different AWS regions within a single CloudWatch dashboard. This enables:
- Global Overview: Monitor resources across different geographical locations, providing insights into regional performance and availability.
- Consistent Monitoring Policies: Apply the same monitoring and alerting policies across regions, ensuring uniformity in your monitoring approach.
- Disaster Recovery Planning: Track and analyze metrics across regions to support disaster recovery and business continuity planning.
How to Set Up
Setting up cross-account and cross-region monitoring in CloudWatch involves:
- Enabling Cross-Account and Cross-Region Support: This can be done through the AWS Management Console, CLI, or SDKs.
- Configuring Permissions: Define IAM roles and permissions to control access to cross-account and cross-region data.
- Creating Dashboards: Build custom CloudWatch dashboards that include metrics from different accounts and regions.
- Setting Alarms: Configure alarms and notifications to respond to cross-account and cross-region events.
Cross-account and cross-region support in Amazon CloudWatch provides a powerful solution for organizations operating in complex, multi-account, and multi-region environments. By centralizing monitoring and control, it enhances visibility, consistency, and efficiency, enabling you to maintain a clear understanding of your entire AWS landscape. Whether you’re managing a global enterprise, running multiple projects, or supporting diverse clients, CloudWatch’s cross-account and cross-region capabilities offer the flexibility and integration needed to navigate complexity and ensure optimal performance, security, and compliance.
Conclusion
Amazon CloudWatch is an essential tool for monitoring and managing your AWS resources, ensuring that you have real-time insights into the performance and health of your applications and services. It supports proactive monitoring, efficient troubleshooting, and effective capacity planning, contributing to the overall reliability and efficiency of your cloud-based infrastructure.
Comprehensive Monitoring Solution
From basic resource monitoring to advanced features like anomaly detection and custom metrics, CloudWatch offers a comprehensive suite of tools that cater to various monitoring needs. Whether you’re a small business or a large enterprise, CloudWatch’s flexibility and scalability make it suitable for all types of cloud environments.
Integration and Extensibility
CloudWatch’s seamless integration with various AWS services and its ability to monitor custom metrics and non-AWS resources provide a unified and extensible monitoring platform. Its cross-account and cross-region support further enhance its capability to provide a centralized view across complex multi-account and multi-region architectures.
Intelligent Insights and Automation
With features like Application Insights and Anomaly Detection, CloudWatch goes beyond mere data collection, offering intelligent insights and recommendations. Its automation capabilities, such as alarms and automated actions, enable you to respond quickly to issues, minimizing downtime and maintaining optimal performance.
Cost Efficiency
CloudWatch’s ability to monitor and analyze resource utilization and performance trends helps in effective capacity planning and optimization. By understanding your usage patterns and identifying inefficiencies, you can make informed decisions that lead to cost savings and better resource allocation.
Security and Compliance
CloudWatch’s monitoring and logging capabilities play a vital role in maintaining security and compliance within your AWS environment. By tracking user activities, system changes, and potential anomalies, you can enhance your security posture and meet regulatory requirements.
Final Thoughts
By leveraging the powerful features of Amazon CloudWatch, you can take control of your cloud environment, making informed decisions that lead to improved performance, cost savings, and a robust, resilient infrastructure. CloudWatch is not just a monitoring tool; it’s a strategic asset that empowers you to understand, manage, and optimize your AWS resources effectively.
Whether you’re just starting your cloud journey or managing a complex, global infrastructure, Amazon CloudWatch provides the insights, tools, and flexibility needed to succeed in today’s dynamic cloud landscape. Embracing CloudWatch means embracing a future where data-driven decisions, proactive management, and continuous innovation are not just possibilities but everyday realities.
Amazon CloudWatch FAQ : Metrics, Alarms, and Insights
What are Amazon CloudWatch metrics and how can they be utilized?
Amazon CloudWatch metrics are data points that monitor the performance and health of AWS services and resources. These metrics can be utilized to observe real-time performance data, such as CPU utilization, disk reads/writes, or network traffic. Users can aggregate and filter these metrics to gain insights into their application’s performance and operational health, enabling proactive optimization and troubleshooting.
How do Amazon CloudWatch alarms work and when should I use them?
Amazon CloudWatch alarms automatically notify users when a metric crosses a specified threshold, enabling them to respond to changes in their AWS environment quickly. Alarms can be used to trigger notifications, automate responses, or take corrective actions, such as scaling resources in response to demand. They are essential for maintaining application availability and performance by ensuring that resources are operating within desired parameters.
Can I create custom metrics in Amazon CloudWatch, and how?
Yes, Amazon CloudWatch allows the creation of custom metrics to monitor application-specific events or operations that standard metrics do not cover. This is done by using the PutMetricData API to publish your custom data to CloudWatch. Custom metrics can be used to monitor business KPIs, application performance, or operational health, providing flexibility to tailor monitoring to specific needs.
What is Amazon CloudWatch Logs Insights, and how does it differ from standard log monitoring?
Amazon CloudWatch Logs Insights is a feature that enables advanced query capabilities to analyze and visualize logs from AWS services, applications, and on-premises sources. Unlike standard log monitoring, which focuses on collecting and storing logs, Logs Insights allows for deep analysis using a purpose-built query language. This enables users to efficiently perform complex troubleshooting, spot trends, and derive actionable insights from their log data.
How can I optimize costs while using Amazon CloudWatch?
Optimizing costs in Amazon CloudWatch involves several strategies, such as choosing the right monitoring resolution, managing data retention policies, and utilizing alarms to automate resource scaling. Users should select the appropriate metric resolution for their needs, as higher resolutions incur higher costs. Additionally, adjusting retention settings for logs and metrics to keep only necessary data and using alarms to scale down resources during low usage periods can significantly reduce costs.
Advance Your IT Career
with ITU Online's LIFETIME Training
Unlock the full potential of your IT career with ITU Online’s comprehensive online LIFETIME Training Library. Our expert-led courses will help you stay ahead of the curve in today’s fast-paced tech industry.


